Statistics! (... and lies, and damned lies)
Craig Paardekooper's weekly cycle graph and conclusion. Please put me right: I'm no statistician.
I recently saw a post (I don’t remember what medium it was on) promoting Craig Paardekooper’s work of March 2022, in which he demonstrated a weekly pattern of deaths which corresponded with the number of people who were injected on that day.
https://www.bitchute.com/video/7Z6aJ0add9SH/
He used the evidence to draw a conclusion, which he explained in a video he posted on Bitchute. Some commenters under the video wrote that they disagreed, but most implied agreement and gratitude for this evidence that the injections were causing deaths.
Now, I would like his conclusion to be true - that this is strong evidence of harm from the covid injections. I declare my bias! Evidence is already strong that this is so, but more solid evidence would help to convince people that what I think is the case is indeed so: the jabs are bad for you.
However, faulty evidence or reasoning would have the opposite rhetorical effect. If you say things that get exposed to be wrong, then that discredits the notion.1
For example, you may have come across the incident depicted in the film “Truth”, either through the movie or by following the events as they occurred (it’s a true story). Basically George W Bush did something iniquitous, and some journalists found out and spilled the beans. To “handle” or minimise the damage from this incident, the Bush team planted some juicy details of the incident with a journalist; oh so tempting! But included amongst the details was one which it was untrue, and which was simple to demonstrate was untrue. Under time pressure, the jounalists published. When the detail which was untrue was revealed to be untrue, the trap was sprung, and the story was tainted. They had created doubt about the larger story.
If Craig does employ faulty reasoning, then we need to stop promoting it, and ideally retract it, so that others do not fall into the same statistical error.
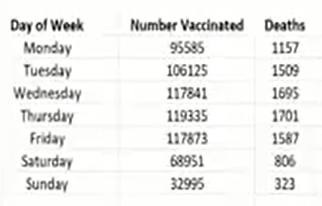
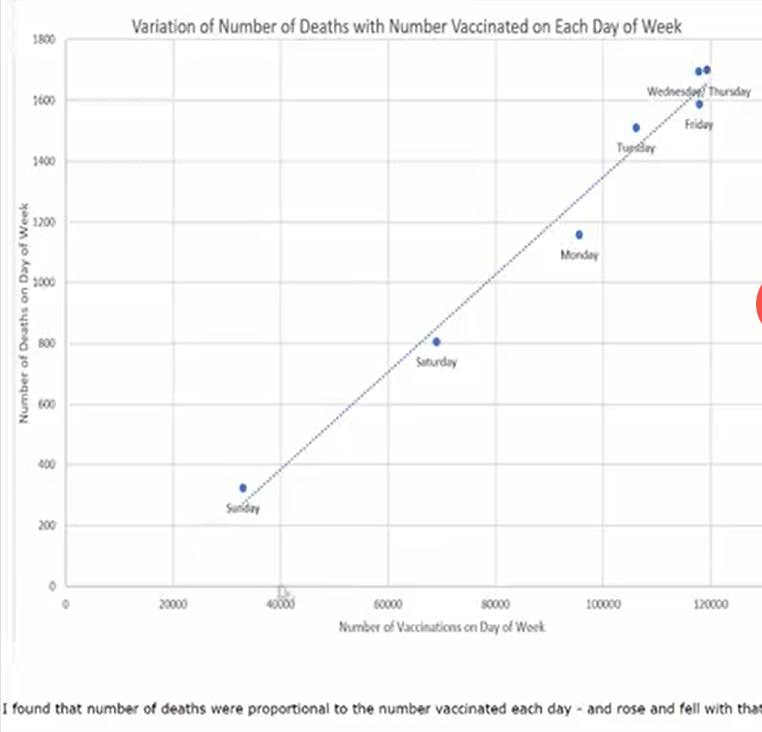
Craig counted, in VAERS (the US Vaccine Adverse Event Reporting System) the number of people who had been injected on a day of the week. He noticed that Sundays had very few vaccinations, and other days had a characteristic number of people, the most popular day was Thursday, closely followed by Wednesday e.g.
So, the big pool of people in VAERS that he was using, was people who had been injected and who had had their potential reaction to the injections (death) recorded on VAERS; and the subset which he counted was those who died after being injected on a particular weekday, ANY Monday e.g.
(Despite what he has written on the y axis, it was not the day they died, but the day they got the injection, and died later, as he makes clear in the text).
He noticed that days which had more injections had more people who later died (who had had the injection on that weekday).
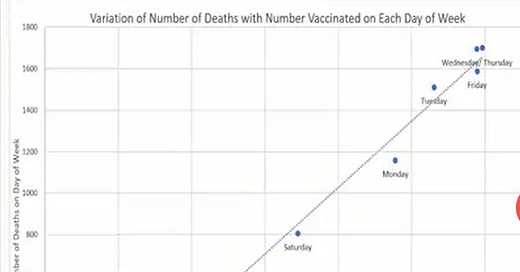
He reasoned that if more people were injected on a particular day, that would result in more deaths among people who were vaccinated on that day. He showed that the correlation between [the number of people who had been injected on that day] and [the number of people who died who had been injected on that day] was very high. See above graph. He said
“the more people vaccinated on a particular day, the greater the number of people who would eventually die, as a result of the vaccinations given on that day”.
A colleague of his counted the deaths associated with each date of vaccination throughout 2021, and the graph above shows the first two months. The weekly cycle is evident.
Now, I think that what Craig said is true, but cannot be concluded from his evidence:
“the more people vaccinated on a particular day, the greater the number of people who would eventually die, as a result of the vaccinations given on that day”.
The reasoning is all correct except for the “as a result of” part. If we rewrite without that phrase, it becomes a statement of the obvious:
the more people vaccinated on a particular day, the greater the number of people who would eventually die, who had had the vaccinations given on that day.
A common way to play with difficult notions to see how they behave is to take extreme cases, or “reductio ad absurdum”. Let’s take his “eventually” literally: if we wait long enough, everybody will die, and it will become completely obvious that the more people vaccinated on a particular day, the greater the number of people who would eventually die, who had had the vaccinations given on that day, because the number of people who died, who had the injection on that day will EQUAL the number of people who were injected that day: they’ve all died)! Would it follow that any of them died as a result of the injection?
Because he believes (as I do) that the injections cause a proportion of people to die, he is assuming the thing he’s supposed to be trying to demonstrate. But of course a day which has twice as many injectees will have twice as many people who die, if a constant proportion of injectees die.
Let’s do a simple thought experiment. Let’s say that a group of nice people make a point of visiting the elderly in old-age homes. One of the things they do is to get the elderly to roll some dice (for some reason which we needn’t go into).
They always do these visits to cheer people up, on a Monday. They become interested in seeing whether their visits help the elderly to live longer. They get the statistics from the old age homes of how many people died in the year.
Then they do the same analysis as Craig. They look at which day of the week the people who died had been visited by them. They are horrified to see that, of the people whom they visited and who died, 100% of them were visited on a Monday, and zero on Tuesday to Sunday! Those visits are surely killing people!
Too obvious for you? Well let's tweak it. Next year they are doing so well, and getting so many volunteers that they get more people involved and expand. Now 2/3 of their visits are on Mondays, and 1/3 on Tuesdays. They do the same analysis as Craig, and see what day of the week each person who died in the next year was visited. Again they are horrified: twice as many people who died had been visited on Monday as Tuesday. Clearly the more they visit, the more people die!
Is that clear enough?
I think it's true that vaccines are killing a proportion of people, and that the greater number of people are vaccinated, the greater the number of people who will die from it. But to discern that the “vaccines” are responsible you have to compare people who were vaccinated and people who were unvaccinated, and look at the death rates of equivalent groups. You cannot look at just the vaccinated.
Or am I wrong? To me it seems as this would be pretty elementary to a statistician.
I suspect Craig should take down that video, and people should ignore it.
I’m not alone. Here are some comments from under his video on Bitchute.
“No conclusion can be made from statements like: the number of “deaths resulting from vaccination” is proportional to the number of vaccines given. Under normal circumstances people die at a near constant rate. The number of people dying in any subset of people is always going to be proportional to the number of people in the group. On Sunday very few people are vaccinated, the number of those people dying [who were vaccinated on a Sunday] is always going to be lower than the number of people dying in larger groups”
Makes no sense to me, surly if more are vaccinated then more deaths and if less then less …
He’s discovered that the number of people dying is proportional to the number of people in the sample size.
If the side effects (inc. death) of the vaccines *on average* remains a constant from day to day (forgetting about Hot Lots for the moment), then OF COURSE we would expect the incidents of reported side effects and deaths to be a function of doses administered.
Craig replies:
“Deaths will only rise and fall with the number of vaccines administered if the deaths are caused by the vaccines, or as you put it, are a function of doses administered. Deaths [are proportional to the number of doses administered]2. My point is that this indicates causation* . The deaths don't have to be immediate (they might even be spread out over a considerable time), but when all the deaths associated with a particular day of administration are gathered together, their total number will be proportional to the number of doses given with a correlation of 0.99.”
Well, if that’s true, the intervention in those old-age homes - i.e. rolling dice - is clearly causing deaths: the number of deaths (of people who were visited) is proportional to the number of interventions! There are none on Wednesdays, a number on Tuesdays, and twice as many on Mondays, when there were twice as many interventions! According to Craig, the fact that they are proportional means that one causes the other. Do you really think that rolling dice on a Monday or Tuesday caused people to die? I imagine not … and yet Craig explains
Deaths will only rise and fall with the number of vaccines administered if the deaths are caused by the vaccines
The number of people who rolled dice on Monday is twice that on Tueday because there were twice as many people visited then. And twice as many people died who had been visited on Monday as a Tuesday because twice as many people were visited on Monday as Tuesday … NOT because they rolled the dice!
To me it seems obvious that that first statement is wrong -
Deaths will only rise and fall with the number of vaccines administered if the deaths are caused by the vaccines
Suppose the vaccines had absolutely no effect whatsoever: you would still find twice as many deaths among those injected on a Thursday if there were twice as many vaccinated on a Thursday.
Here’s another comparison. In car crashes, the cars involved all have someone sitting in the driver’s seat, and 20% have someone sitting in the passenger seat3. So - make sure you sit in the passenger seat, as it is 5 times safer! (No: only a fifth of people involved in car accidents are sitting in the passenger seat because only a fifth of people in cars generally are in the passenger seat. The sample (those killed) is merely proportional to the size of the whole population. The population of people in drivers’ seat is five times that of the passenger seat).
And another. They introduced compulsory helmets for motorcycle riders. But if we consider whether helmets have made it safer, we find that nowadays almost all the people killed are wearing a helmet and far more than were doing so before the law change! Clearly the helmets have made it much less safe!? (No, the population - people wearing helmets - from which the sample - those having accidents - is taken, is much bigger now).
*Or to put it even more succinctly - “correlation does not prove causation”!
Now, I’m a big fan of someone like Craig, who has done some really significant work in collecting data from VAERS, and analysing it, and making the “how bad is my batch” website. He has achieved a great deal more than me, with my few, dilettante efforts at making a difference.
People make mistakes, though: I think he needs to recognise this one.
If anyone can remember who it was who promoted that video, I’d like to be able to send this to them. One of Substack’s faults is that the phone app doesn’t have a “back” button, nor a history. Unfortunately it was on the phone where I saw the post I’m thinking of, which was promoting Craig’s video.
Final thought. There may be something interesting to notice from his graph. Here it is again
.You can see that he says “I found that number of deaths were proportional to the number vaccinated each day …”
Well that’s not quite right: if that were so, the graph would be a straight line through the origin (where the axes meet at 0,0). You can see that the straight line that he has drawn does not go through the origin.
Moreover, if we imagine that there had been a day of the week when there were never any vaccinations, then there would necessarily be no deaths associated with a vaccination on that day of the week. It happens that there were a few on Sundays, but if we imagine that there were zero, then we would be certain how many deaths there would be associated with an injection on that day: none.
So let’s include the zero, zero point. It’s the one point we know with complete accuracy.
And now let’s notice which side of the line that he has drawn, the points lie: near the bottom they are to the left of the line, in the middle they’re on the right, and at the top they are mostly on the left.
So although we might have expected a straight line through the origin, a better line of fit through all eight (now) points is a curve - upwards if you start at zero.
This indicates that on days when they were busier doing injections, a higher proportion of deaths occurred (later) than on more relaxed days. That’s interesting. What explanations can you come up with to explain that?
I’m very bad at promoting this Substack: I don’t have a Facebook account or Twitter or any other social media! So if you think that other people would benefit from a post, please do share it.
The fact that such a discrediting effect is not logical merely emphasises the obvious - that people do not think logically!
I’ve paraphrased what he actually said here, which was “Deaths = k x doses administered, where k is a constant.”
I’m making up statistics to make a simple point. I’m pretty sure that virtually all cars being driven have someone in the driver’s seat; I’m guessing at 20% for the proportion with someone in “the passenger seat” and ignoring those in the back seats completely!


Good catch. His argument is not even logical.
I happen to go to a specific store on Thursdays. Does that mean all those people died because of that? Should I switch to Wednesday to save grandma?
It's very much like when testing increased dramatically and lo and behold, there were more positive tests.
Newspapers did not talk about the _rate_ of positive tests per thousand given, only that the absolute number of positives had gone up.